Property diagrams are used as graphical representation of a phase change for a pure substance. There are three types of property diagrams that I am going to discuss. They are the T-ν, P-ν, and P-T diagrams.
T-ν Diagram
A T-ν diagram is a property diagram that relates temperature to specific volume when a pure substance is at a constant pressure. Below is a graphical example of three different T-ν diagrams.
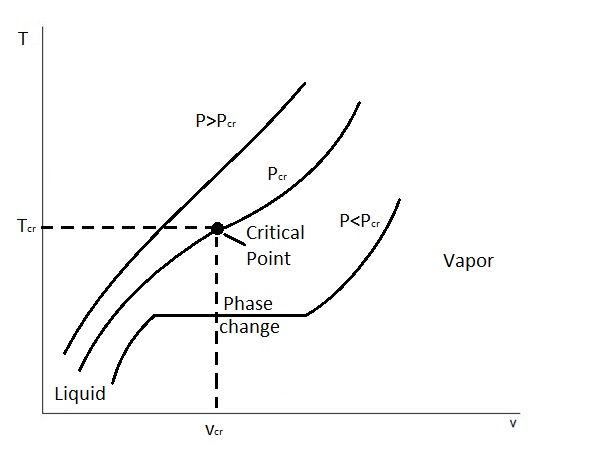
These three T-ν diagrams represent how pressure will effect the phase change process. First, on this graph you will notice a point called the critical point. The critical point is defined as the point at which the saturated liquid and saturated vapor states are identical. In turn, this point is located where the critical pressure line $P_{cr}$, critical temperature$T_{cr}$, and critical specific volume $ν_{cr}$ intersect.
There is, however, states at which the constant pressure can be below or above the critical pressure. For states that are below the critical pressure, $P<P_{cr}$, there will be a phase change line. On the phase change line, or saturation line, the pure substance will exist as a liquid and a gas. In addition, as energy is added into the system the specific volume of the substance will increase while the temperature remains the same. Finally, the lower pressure is in comparison to the critical pressure, the longer this phase change line will be.
On the other hand, there are also cases where the pressure is greater than the critical pressure. When this occurs there is no phase change line. Instead only one phase of the pure substance is present. Basically, a liquid will eventually resemble a vapor. However, we will not be able to tell when the change occurred.
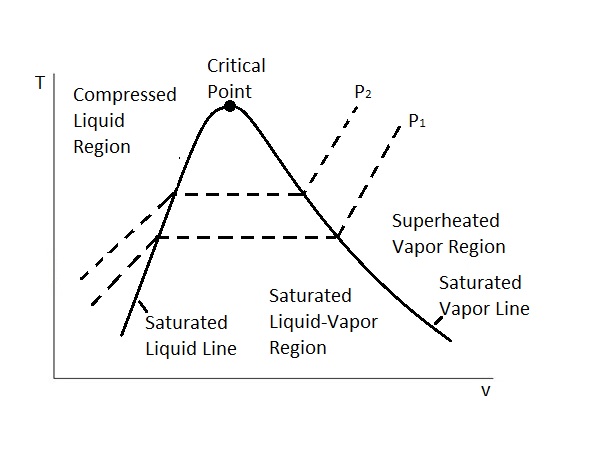
Finally, for the different pressures up to the critical pressure the saturated liquid states can be connected by a line called the saturated liquid line. In addition, the saturated vapor line connects the saturated vapor states. This can be seen in the t-ν diagram below.
P-ν Diagram
The next type of property diagram is called the P-ν diagram. In this cause we are looking at pressure, P, vs the specific volume, ν, of a pure substance. In turn, this property diagram is very similar to the T-ν diagram except instead of there being a constant pressure the temperature is constant.
Like the T-ν diagram there is a critical point. The critical point represents where the critical pressure, critical specific volume, critical temperature intersect. Below the critical point is the saturated liquid-vapor region. In this region the substance will exist as both a liquid and a gas. In addition, there is also a saturated liquid line and a saturated vapor line. To the left of the saturated liquid line the substance will exist as a compressed liquid. On the other hand, to the right of the saturated vapor line the substance will exist as a superheated vapor. Above the critical point we will not be able to tell when the liquid changes from a liquid to vapor. The image below shows a P-ν diagram of a pure substance.
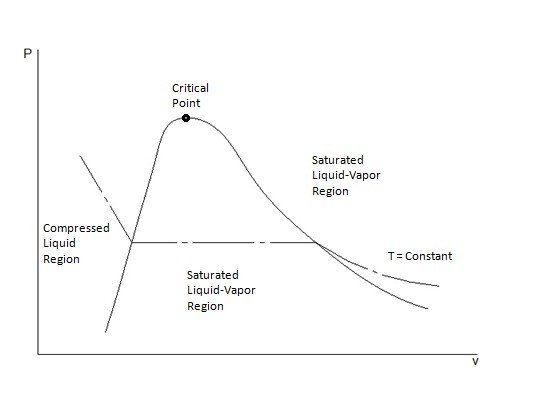
From this diagram it can be seen that the temperature remains the same. In order for this to occur the pure substance must exchange heat with its surrounding. Finally, it can also be seen that as the pressure decreases the specific volume will increase.
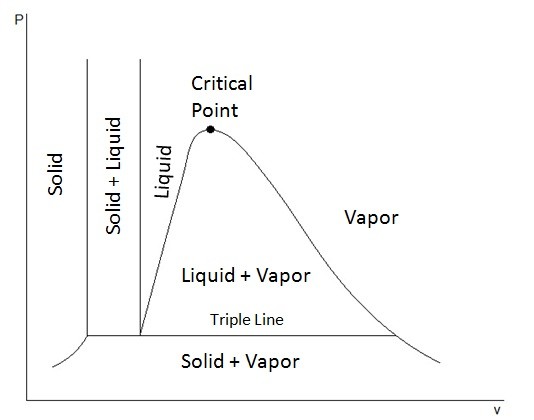
Extended Diagrams to Include the Solid Phase
In addition, to showing the liquid and vapor phase, these diagrams can also show the solid phase and solid-liquid phase. Depending on the if a substance contracts or expends when it freezes determines what the extended P-ν diagram will look like. This first diagram below represents a substance that will contract when it freezes. This is how most substance will behave.
However, there are substances, like ice, that will expand when they freeze. This next diagram shows the extended P-ν diagram for a substance that will expand when it freezes.
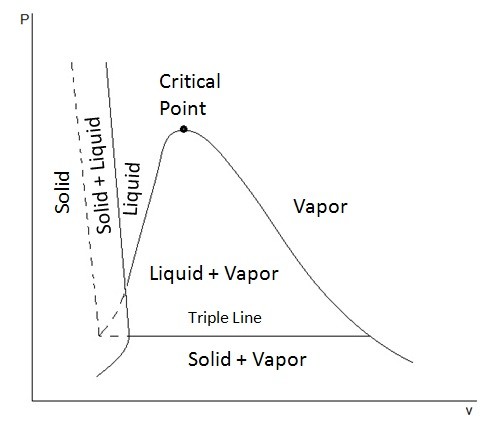
In these diagrams you may have noticed a line called the triple line. The triple line represents a condition where all three phases, solid, liquid, and gas, coexist in equilibrium. In turn, the states of a substance on the triple line will have the same temperatures and pressure but different specific volumes.
Finally, from these diagrams it can also be seen that a solid can pass directly into the vapor phase. This is known as sublimation.
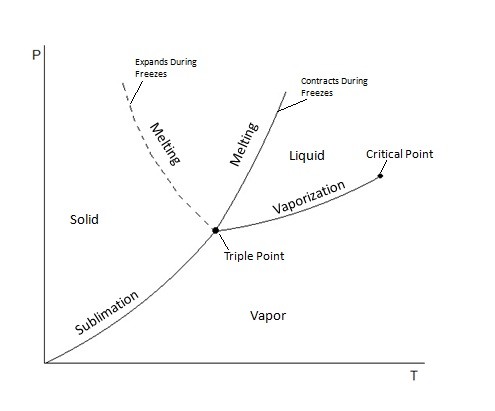
P-T Diagram
The final property diagram is called the P-T diagram. For this we are looking pressure vs temperature. This diagram is often referred to as the phase diagram. In this diagram you will be able to see three different lines. This line represent sublimation, melting, and vaporization. Where these lines intersect is called the triple point. The triple point is where all three phases coexist in equilibrium. Below is an example of what a P-T diagram looks like.