Part of thermodynamics is understanding what the phases of matter are. For the most part when dealing with a phase shift you will be looking at a pure substance. A pure substance is matter that has a fixed chemical property. An example of a pure substance is water, helium, hydrogen, etc. While an example of a substance that is not a pure substance would be water and oil. In addition a substance is considered a pure substance when the chemical composition does not change when there is multiple phases present. An example of this would be ice water.
There are three principle phases of matter that exist. They are solid, liquid, and gas; which I am sure you are aware of. However, it is possible that there can be several phases within a principle phase. An example of this would carbon in its solid phase. In its solid phase, it could become graphite or it could become diamond. What determines these sub-phases are the conditions of surroundings when the substance was entering the principle phase. For example, to create a diamond, a large amount of pressure is required, while graphite doesn’t need large amount of pressure to be created.
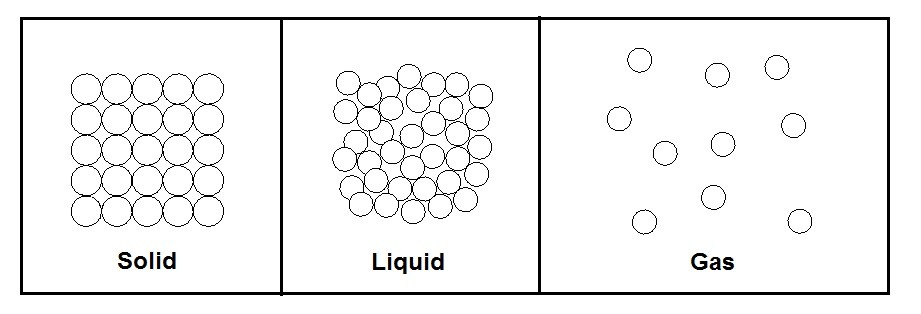
The different types of phases can easily be distinguished from one another by their molecular arrangements that are homogenous and easily separated from other phases by distinct boundary surfaces. A solid for example has the strongest molecular bonds, while gases have the weakest molecular bonds between the molecules that make up the substance. Solid phases also have a very distinct molecular arrangement where the molecules are held in place and do not move. They do however vibrate in place, and as the temperature of the solid increases the vibration of each molecule will also increase until a phase change occurs, and the solid melts into a liquid. A liquid’s molecules, like a solids molecules, remain fairly close to each other, but unlike a solid, a liquid’s molecules do not hold a specific shape but instead flow over each other. Finally, a gas’s molecules repel each other causing a great distance between the molecules, which is why a gas fills its container. The molecular make up of each phase can be seen in the figure below.
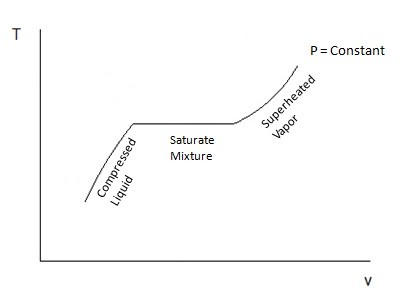
When a phase change occurs, the saturated mixture will remain at the same temperature until the phase change has been completed. During this process heat does still leave or enter the substance as energy; this is known as latent heat. Certain substance require more latent heat to pass in or out for the phase change to be completed. Once the phase change has been completed, if it was between a liquid or a gas, then the substance would either be considered a compressed liquid or a superheated vapor, which basically means no phase change is taking place and temperature will change assuming pressure is held constant. Refer to the figure below.
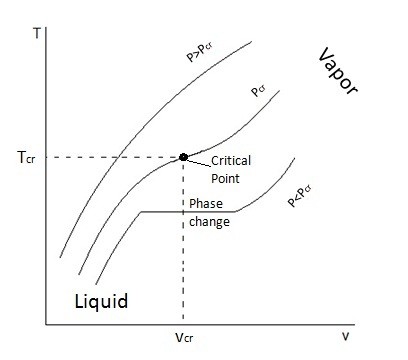
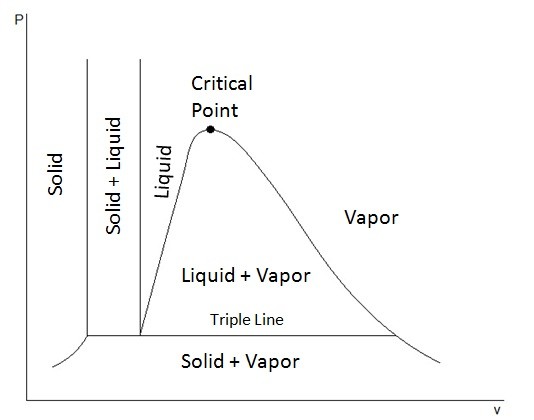
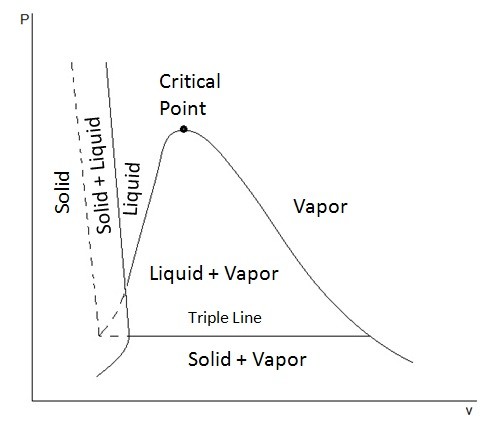
T-v and P-v Diagrams
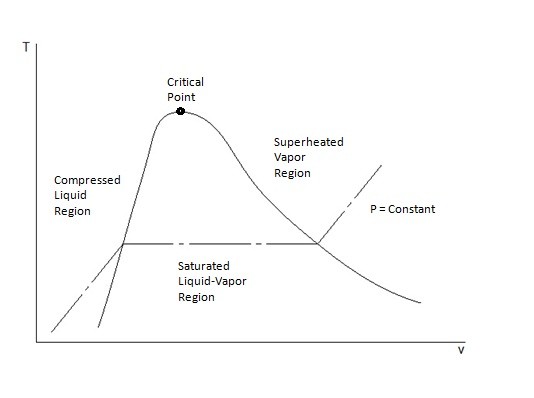
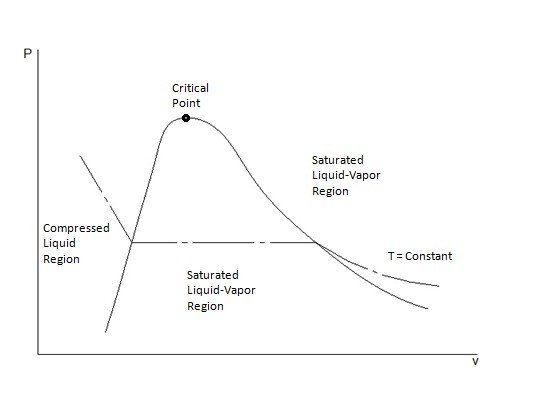
T-v and P-v diagrams are used to relate the temperature or the pressure to a change in a substance’s specific volume. Refer to the figures below to view a T-v diagram and a P-v diagram.
P-T Diagram
The P-T diagram also known as the phase diagram is used to show where the phase change of a substance will occur when it is at a certain temperature or pressure. To see what a P-T diagram looks like refer to the figure below.
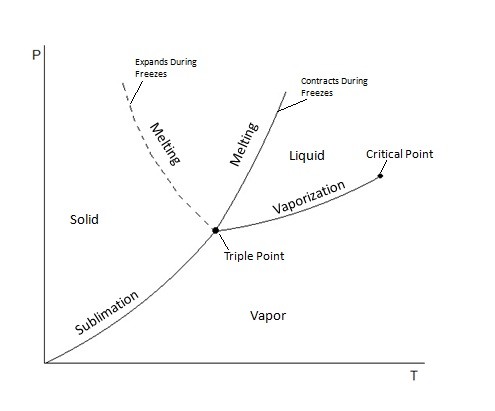
The triple point represents where the tipple line would occur on the P-v diagram, or in other words all three phases could exist together at that point.