The field of fluid mechanics relies heavily on empirical data. As a result, correlation of experimental data is a must when performing dimensional analysis. Recall that dimensional analysis does not provide a direct answer. Instead it creates dimensionless groups called pi terms. In turn, the relationship between these pi terms is obtained through suitable experimental data. The difficulty of this process depends on how many pi terms are required. In addition, the difficulty of obtaining certain measurements will also effect the reliability of the data.
One Pi Term
Using Buckingham Pi Theorem, if the number of variables minus the number of reference dimensions is equal to unity than one Pi term will result. In turn, this is expressed using the following expression.
(Eq 1) $Π_1=C$
where $C$ equals a constant
Example
As a sphere falls slowly through a viscous fluid, the drag $D$ acting on the sphere is a function of the sphere’s diameter $d$, velocity $v$, and the fluid’s viscosity $μ$. How is the drag dependent on particle velocity?
First, from this information we can derive the following function.
$D=f(d,v,μ)$
Next, the variables must be broken down into their basic dimensions.
$D=F$
$d=L$
$v=LT^{-1}$
$μ=FL^{-2}T$
In turn, from this it can be gathered that there are four variables with three reference dimension ($F$, $L$, and $T$). As a result, from Buckingham Pi Theorem, only one Pi term is required. Hence, taking this into consideration, the following pi term will result.
$Π_1=\frac{D}{μvd}$
Due to the fact that there is only one pi term, the following expression is used.
$\frac{D}{μvd}=C$
or
$D=$Cμvd$
As a result, the drag will vary directly with the fluid velocity.
$D∝v$
This dimensional analysis also shows the drag is proportional to the spheres diameter as well as the fluid’s viscosity. However, at this point we do not know what the constant C equals. In order to determine this we will need to perform an experiment. During this experiment we will have to measure drag as well as the corresponding fluid velocity. Finally, this experiment should be performed multiple times to obtain a reliable value for $C$.
Note, since a dimensional analysis was performed, $C$ can be considered a universal constant. As a result, additional experiments with different sphere diameters, or fluid viscosity are not needed. But in order for this statement to hold true drag must only be a function of sphere diameter, fluid velocity, and fluid viscosity. Hence, if additional variables are needed than the results obtained will not be correct.
Two Pi Terms
There are certain times when a phenomenon can be described using two Pi terms. Hence, the following mathematical expression is used to represent this situation.
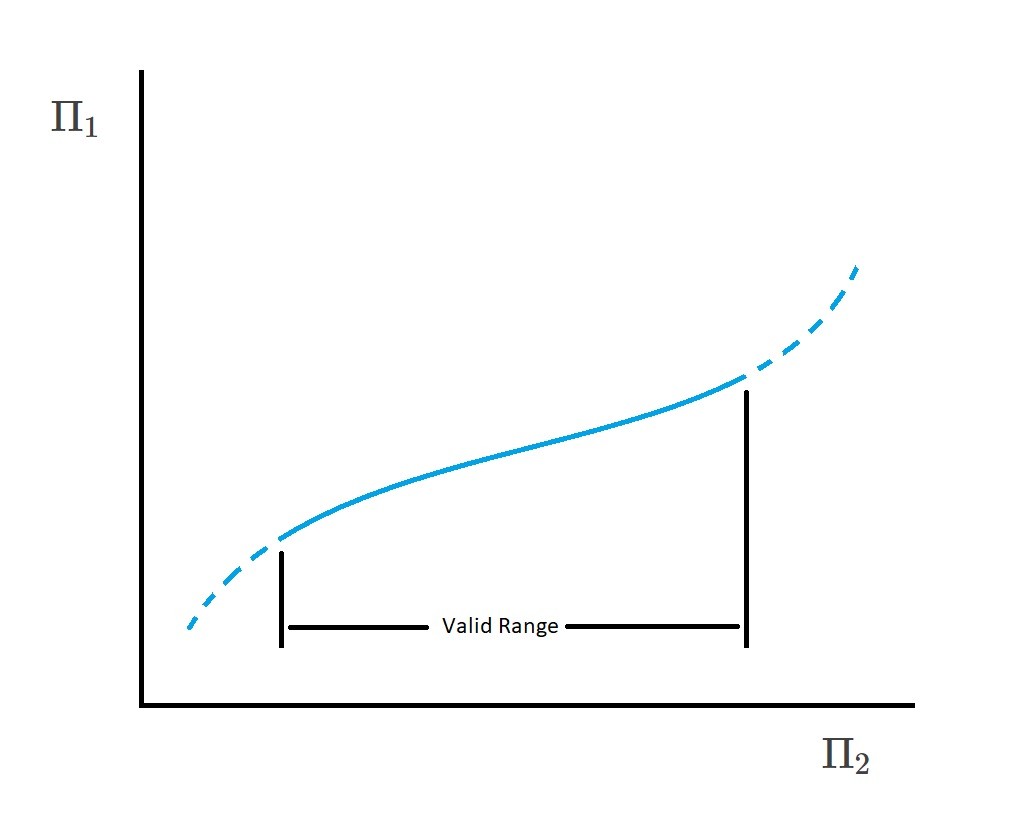
(Eq 2) $Π_1=Φ(Π_2)$
A mathematical function between the two Pi terms can be created by varying one of the terms and seeing how that variation will effect the other term. As a result, a graphical form can be presented by plotting $Π_1$ versus $Π_2$. In conclusion, as long as the correct variables are chosen than there is only one singular relationship between $Π_1$ and $Π_2$. However, even though this statement is true, it is only true for the range covered by the experiment. In other words you should not extrapolate beyond the range of data that was originally collected.
Multiple Pi Terms
There are also cases where more than two pi terms will be required. When this is the case the following mathematical expression is used.
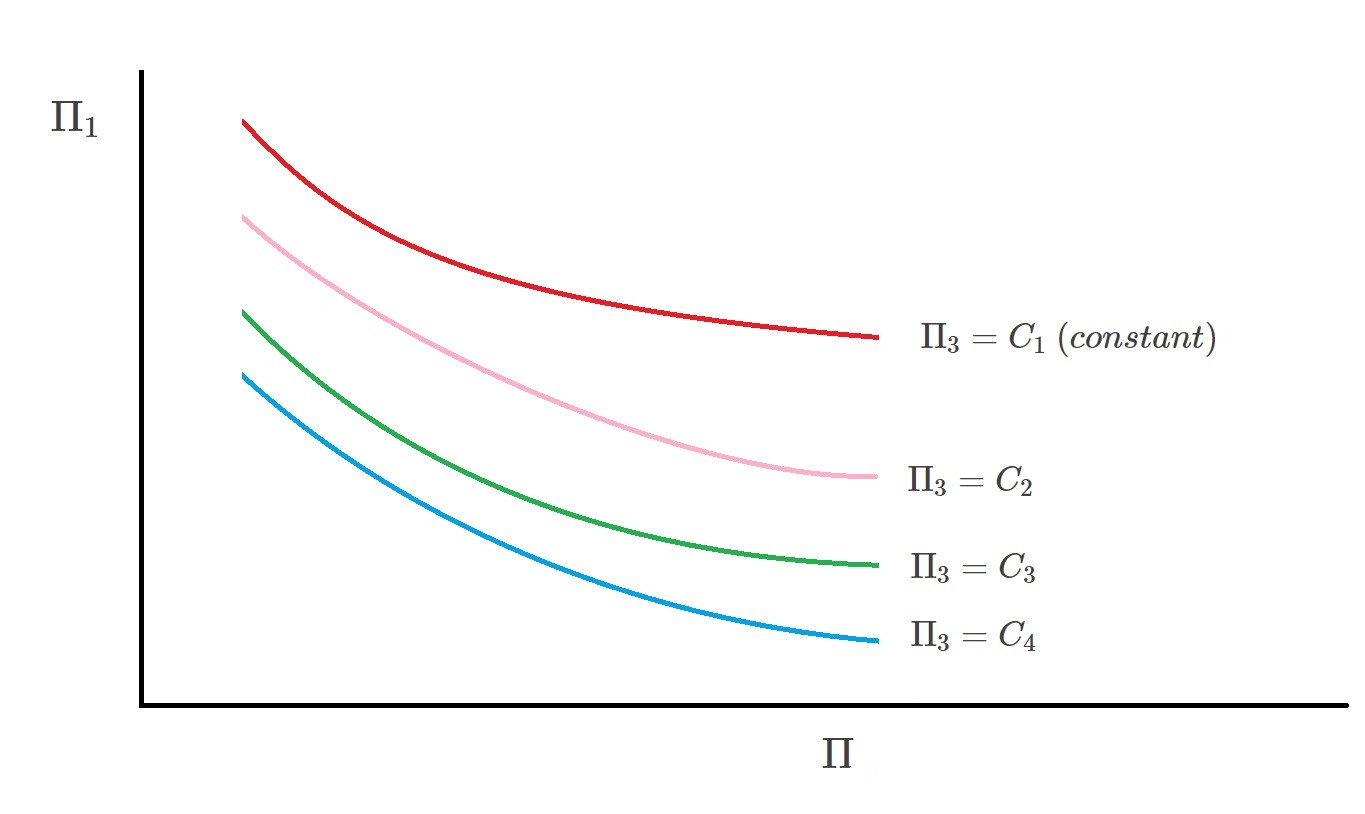
(Eq 3) $Π_1=Φ(Π_2,Π_3,…,Π_n$
However, more pi terms will make it more difficult to display the results in graphical form as well as determine a specific empirical equation. In order to help solve this dilemma a family of curves can be plotted. In turn, this will provide a general form to represent the data. Below is a general family of curves that would be used for three pi terms.
$Π_3=C_1~(constant)$
$Π_3=C_2$
$Π_3=C_3$
$Π_3=C_4$
Finally, as mentioned the more pi terms that are required the more complex the problem will become. As the complexity increases it will become impossible to form an empirical equation or create a graphical representation. When this occurs it is better to use a model to predict the characteristics of the system instead trying to find a general correlation for the data.